
Google Search Console 101

If you are serious about improving your site’s visibility, Google Search Console (GSC) is non-negotiable. Often called the "OG" of SEO platforms, this free tool from Google tells you exactly what the search engine sees when it crawls your site, rather than what a third-party tool thinks is happening. It also tells you which Google searches are bringing you traffic and impressions. In fact, many expensive third-party tools actually use data from GSC.
For business owners, GSC is the bridge between having a "pretty" website and having a high-performing revenue engine. Granted, GSC won’t build that engine for you, but it will give you data that supports website decisions, and performance numbers on the changes you make.
Google Search Console is one of the first things we set up on new and redesigned website builds. Why? Because the sooner we plug it in, the more data we accumulate — and the sooner we can show our clients data-based results.
Setting up Google Search Console
Create your GSC Account
Log into the GSC portal with your Google/Gmail account (preferably the same email you use for your Google Business Profile, Google Analytics, Google Ads, etc. - it will make everything easier down the line). Once you’re in, add your "Property" (your website URL).
Verify your website ownership
Of course, you must prove you own your website. Google offers several methods for verification, and some are easier than others! You can upload an HTML file, add a certain DNS record, or use your existing Google Analytics tracking code.
Submit your Sitemap
Once verified, you need to help Google find your content. Create an XML sitemap (most platforms like Squarespace or Shopify — even WordPress — generate this automatically) and submit the URL to it in the "Sitemaps" section of GSC. Sitemaps act as a roadmap for Google's crawlers to find new or updated pages.
Pro-Tip: Whenever you add pages or change URLs to existing pages, submit a new sitemap to GSC.
Let the data roll in
Sit back and let Google crawl. In a few weeks, you should have a better picture of your Google search performance!
Recommended but optional: Link to Google Analytics
For the most complete view of your website performance, link your GSC account to Google Analytics 4 (GA4). This allows you to see how search behavior and resulting traffic directly impacts user actions on your site. Don’t have Analytics set up yet? We’ll be making a post on it at some point, so hold tight.
A Quick Tour of the GSC Dashboard
GSC is packed with features, but four areas are critical:
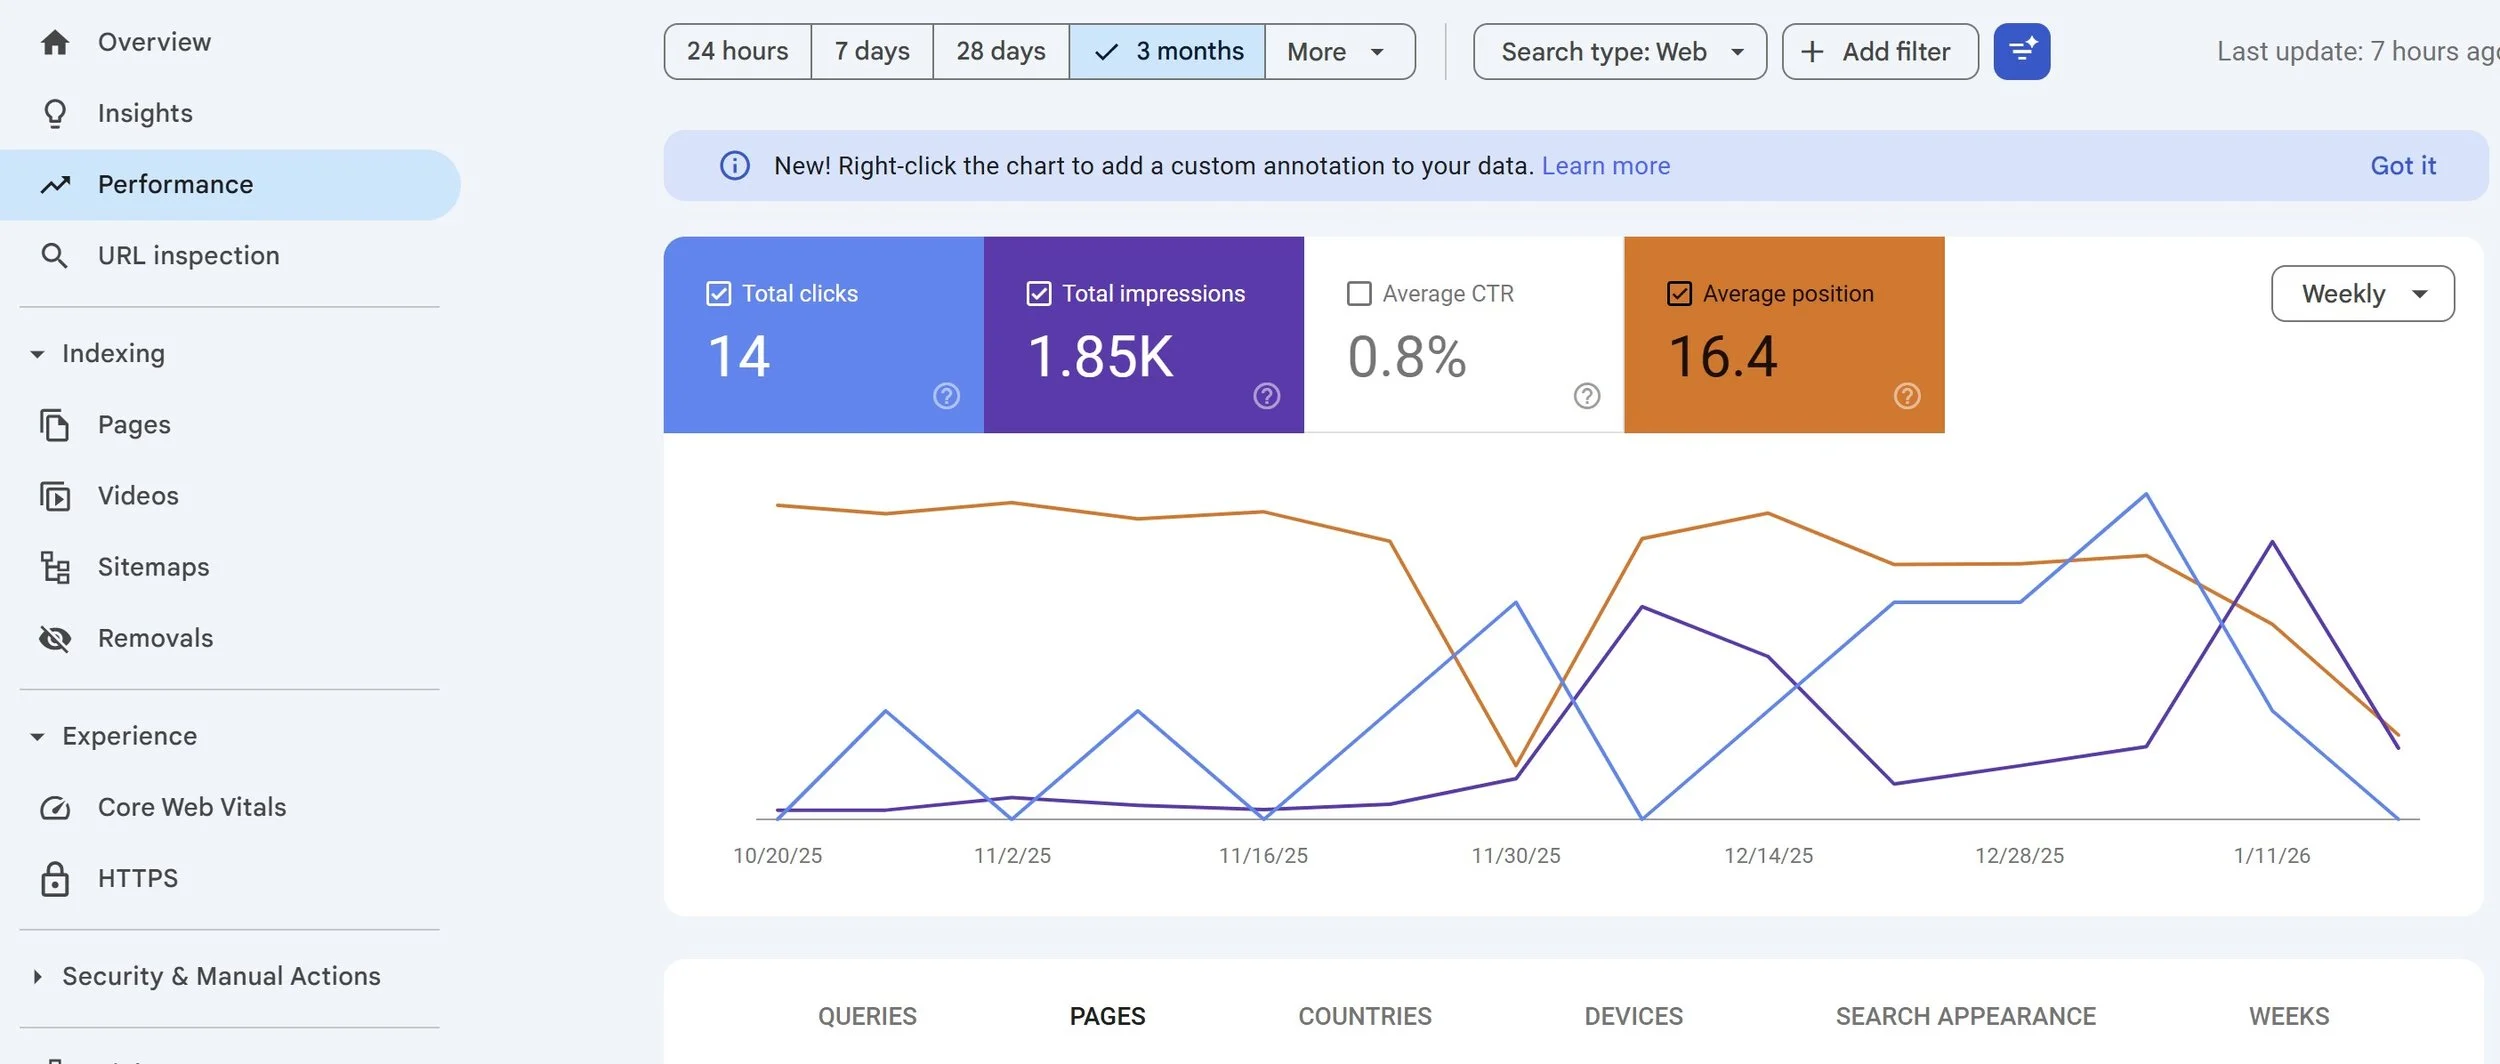
Performance Report: This is your command center. It shows you your average Google search rankings (position), how many people see your site in search results (impressions), and how many actually click through (clicks).
URL Inspection Tool: Ever wonder why a specific page isn't ranking? Paste the URL in the inspection tool to see if Google has successfully indexed it or if technical errors are blocking it. You can even see a screenshot of how Google "renders" the page.
Indexing (Pages) Report: This identifies "Zombie Pages"—low-value pages that take up "crawl budget" without helping users—and alerts you to pages that are "Crawled – currently not indexed.”
Experience & Core Web Vitals: This report measures your site’s "reputation score" based on speed, mobile usability, and visual stability. It specifically tracks metrics like Loading Speed and Responsiveness.
Tips For Interpreting Google Search Console Data
Once you have GSC set up and your sitemap is submitted, you’ll need to wait a few weeks for it to generate some data for you. By checking it monthly, you can move from guessing to making data-driven decisions that grow your leads and revenue. When you get a few weeks or months of data to work with, here are some tips on how to use it.
See broad traffic trends: In the Performance section, change “Daily” to “Monthly” to see past the daily data and into broader trends in your website traffic. You can also use the “Compare” function to compare the four data sets year-over-year, month-over-month, or a custom stretch.
Annotate your Performance graph: If you see a traffic spike, impressions dip, or other major swing in the Performance graph, see if they align with any recent website edits or content additions. If so, right-click the corresponding part of the graph, and leave yourself a note saying what you changed. This is an excellent way to keep track of what works and doesn’t work!
Look for new page opportunities: In the Performance section, scroll down to the list of keywords under the “Queries” tab, and sort them to show your highest impressions. There will likely be terms that result in high impressions and low clicks, and if you don’t have page URLs that match those search terms, consider creating those pages.
Identify high- and low-performing pages: In the second section on the Performance page, click “Pages.” There, you’ll see a list of your website’s pages, along with clicks, impressions, and average search position for each page.
Rule of thumb: It’s always good to update your content regularly, but if a page is doing well, try not to change too much about it.
Need more help with google search console?
Shoot us an email today!